What is a charging curve?
Ever wondered what State of Charge means? Or why your electric car seems to take longer to charge the more full the battery gets? We have you covered.
Do you recharge on the go? However frequently you use a public charger, learning about your electric vehicle’s charging curve can be a real time-saver in the long run. In the last article of our charging rates series, we introduced you to the factors that can affect the speed your electric vehicle (EV) charges at a public charger. Today we are deep-diving into the world of charging curves so that you come away with a clearer understanding and ability to decipher the data to save you time in the long run.
So, what exactly is a charging curve?
A charging curve represents the variation in the speed at which your EV charges during a session. When you arrive at a public charger with low battery, your EV’s battery will initially pull power at a slower rate. Then, when the battery is around 20% the charge rate will sharply increase until it reaches the charger’s peak power output or your car’s ‘max charge rate’. It is important to note here that there is a window during which your EV battery will reach its maximum charging speed during the charging session, this varies between the make and models of cars. As the battery gets progressively fuller, the rate at which the battery is charged will begin to slow down as the car pulls less power from the charger in order to protect the battery. This behaviour across a charge results in the charging curve.
A common misconception is that a car should charge at its peak rate for the duration of the charge, however, this is not the case. The battery will likely reach its peak charge rate at some point if there are no limiting factors at play, and the car will subsequently slow it down. The point at which this happens varies from model to model, and some car models step down the rate gradually rather than a steep drop off, but it is typically around 80% state of charge (SoC).
Why is a charging curve important?
To put it simply, a charging curve will indicate the maximum charge you can expect to pull at any given time. Understanding this for your car can help you plan your charge times and help you get back on the road as quickly as possible, rather than perhaps wasting time waiting for the final 10%.
In an ideal world, the shape of the graph should be very similar when arriving with the same SoC, however, there are various factors that cause the charging rate to change and therefore produce a different charge curve, from battery temperature to weather conditions.
Do charging curves vary from car to car?
Charging rates do differ between car makes and models. Some EVs will be able to pull a consistently higher power from chargers and display a more constant charging curve with a steady deceleration as the battery becomes fuller, whilst other vehicles may not be able to achieve the maximum charging rate but the overall shape of the curve will remain the same.
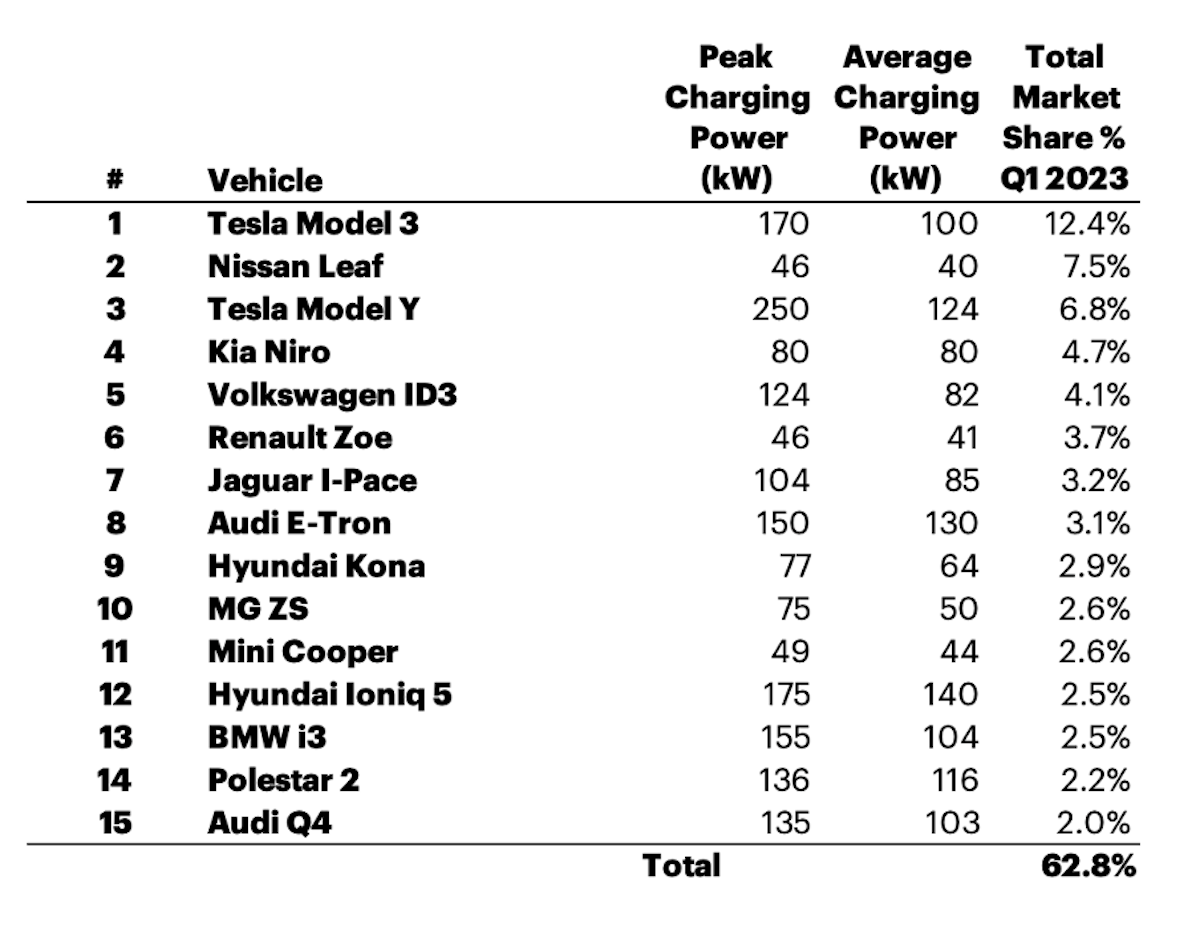
Sources: Department for Transport Vehicle licensing statistics, Q1 2023, EV-Database, OEM brochures
Find out your car’s maximum charging speed at any one of Osprey’s chargers using our Charging Rate Calculator.
Perhaps a more relevant factor is your EV’s average charge power (ACP). This indicates the average amount of power the car pulls from a charger in a typical charging session and will be a better indicator for overall charging time. You can read more about this here.
Charging etiquette
A very heated topic among EV drivers is around the length of time spent at a public rapid charger and charging etiquette. As previously explained, once a battery reaches 80% charge, the amount of power pulled from the charger typically slows down a great deal. Let’s look at this real-life example of a high-powered car charging at our Banbury Cross Retail Park hub.
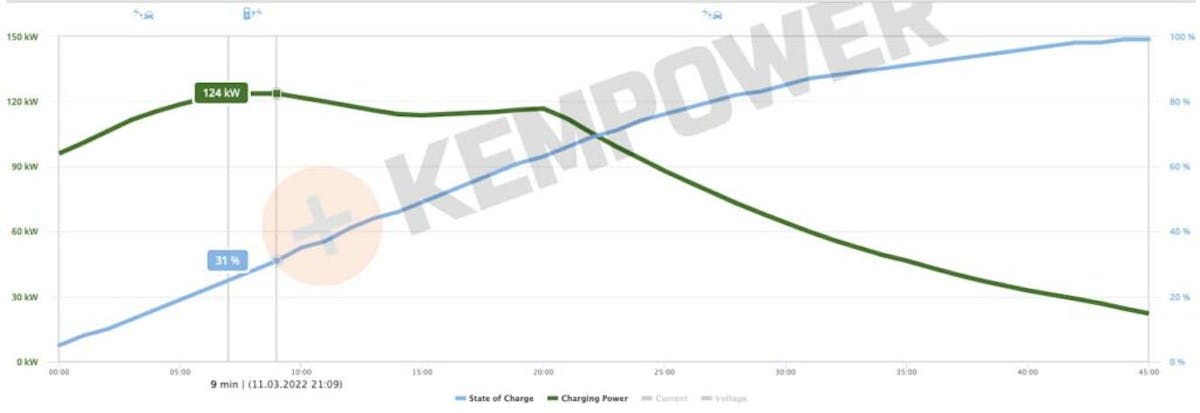
Source: Osprey back-office data
In this real-life example, we can see that the car began charging with only 4% and reached 80% charge in 26 minutes. The time to get from 80% to 100% took an additional 19 minutes, however, the car remained plugged in a further 35 minutes after the car requested to end the session, resulting in the overall charge time accounting for a whopping 81 minutes. This is a disproportionately long time to achieve another 20% charge and prevents opening up both the bay and, at traditional chargers, power for the next driver, so it is advised to not overstay at rapid units.
At Osprey, we are building larger sites to maximise availability. We cater for different lengths of stays by installing rapid units with appropriate amounts of power, and at our hubs, we re-route unused power to other cars through clever load-balancing. For example, we have our load-balancing chargers at the Costa Spring Road site in Wolverhampton, which cleverly assigns appropriate power to each vehicle on-site, depending on where in their charging curve they are. If you go to spend some time in the Costa café while you wait for your charge, and your charge rate has dropped off, a short-stay customer can take that unused power through a different charger, for a high-rate quick charge.
Moreover, our Purley Cross Retail Park site in Croydon showcases our first blended hub, which has 75kW chargers, matching the longer dwell times of Smyths and Aldi, and 175kW chargers that are perfect for a quick visit to Starbucks.
Max charge rates
Find out the maximum charge your car can get on any one of our chargers across the Osprey network.